Average costs by food category in 2014
The Healthy Food Access Basket (HFAB) survey measured the cost of the 5 food groups, 5 unhealthy foods, and 2 tobacco items in Queensland in 2014.
This section lists the average cost for each food group and the price difference between very remote areas and major cities.
- Fruit
- Vegetables and legumes
- Grain foods
- Lean meats, poultry, fish, eggs, nuts, and seeds
- Milk, yoghurt, and cheese
- Unhealthy foods and tobacco
Fruit
One person household
- Average cost: $15.95.
- $7.13 (45.2%) more in very remote areas than in major cities.
Two person household
- Average cost: $32.34.
- $13.24 (41.4%) more in very remote areas than in major cities.
Three person household
- Average cost: $45.61.
- $18.92 (42.0%) more in very remote areas than in major cities.
Four person household
- Average cost: $61.51.
- $26.05 (42.8%) more in very remote areas than in major cities.
Six person household
- Average cost: $90.21.
-
$36.12 (40.7%) more in very remote areas than in major cities.
Figure 6: Cost of fruit - average and range
The small black bars represent the range of the minimum and maximum basket cost for each remoteness classification.
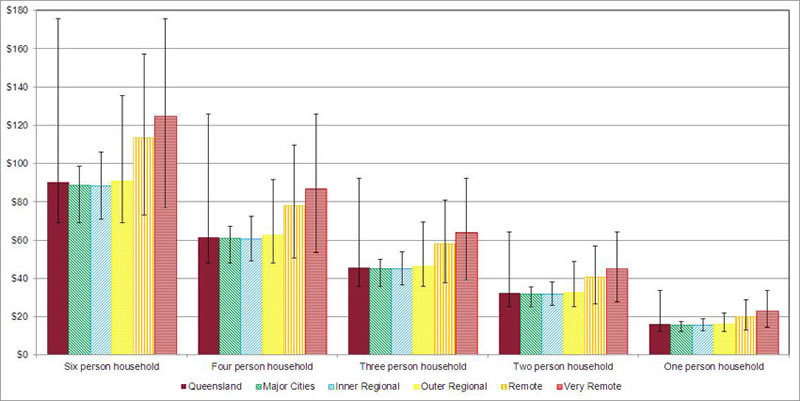
Healthy Food Access Basket Survey 2014, Queensland Government Statistician's Office, Queensland Treasury and Trade.
© The State of Queensland (Queensland Treasury and Trade) (2014). Creative Commons: BY. This figure is suitable for Open Data.
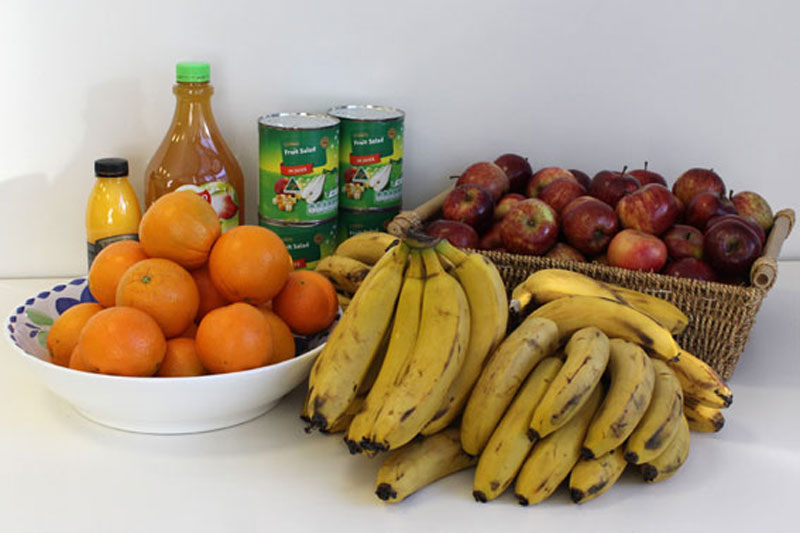
Figure 7: Quantity of fruit for 6 person household
Vegetables and legumes
One person household
- Average cost: $34.03.
- $4.98 (14.7%) more in very remote areas than in major cities.
Two person household
- Average cost: $59.44.
- $7.40 (12.5%) more in very remote areas than in major cities.
Three person household
- Average cost: $80.67.
- $9.22 (11.4%) more in very remote areas than in major cities.
Four person household
- Average cost: $114.68.
- $14.21 (12.4%) more in very remote areas than in major cities.
Six person household
- Average cost: $166.98.
-
$20.69 (12.4%) more in very remote areas than in major cities.
Figure 8: Cost of vegetables and legumes - average and range
The small black bars represent the range of the minimum and maximum basket cost for each remoteness classification.
Source: Healthy Food Access Basket Survey 2014, Queensland Government Statistician's Office, Queensland Treasury and Trade.
© The State of Queensland (Queensland Treasury and Trade) (2014). Creative Commons: BY. This figure is suitable for Open Data.
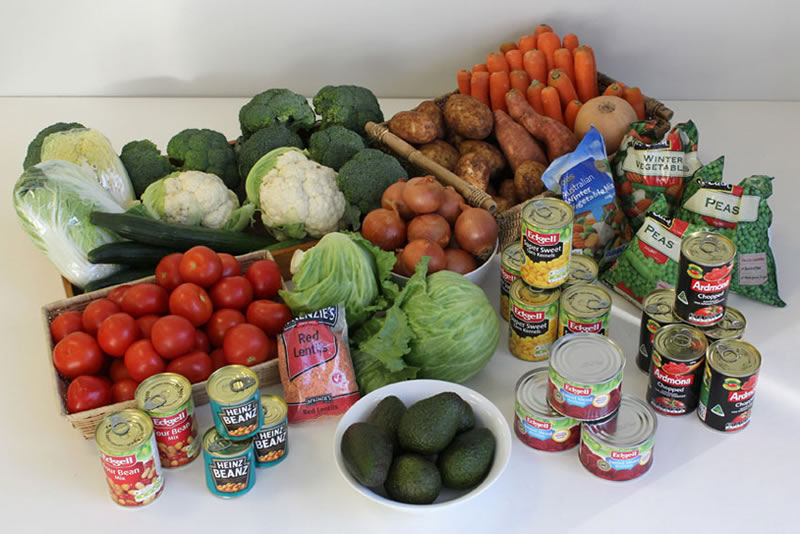
Figure 9: Quantity of vegetables and legumes for 6 person household
Grain foods
One person household
- Average cost: $15.58.
- $4.27 (28.9%) more in very remote areas than in major cities.
Two person household
- Average cost: $19.69.
- $5.40 (28.8%) more in very remote areas than in major cities.
Three person household
- Average cost: $43.24.
- $12.39 (30.1%) more in very remote areas than in major cities.
Four person household
- Average cost: $58.70.
- $16.68 (29.8%) more in very remote areas than in major cities.
Six person household
- Average cost: $77.44.
-
$22.01 (30.1%) more in very remote areas than in major cities.
Figure 10: Cost of grain foods - average and range
The small black bars represent the range of the minimum and maximum basket cost for each remoteness classification.
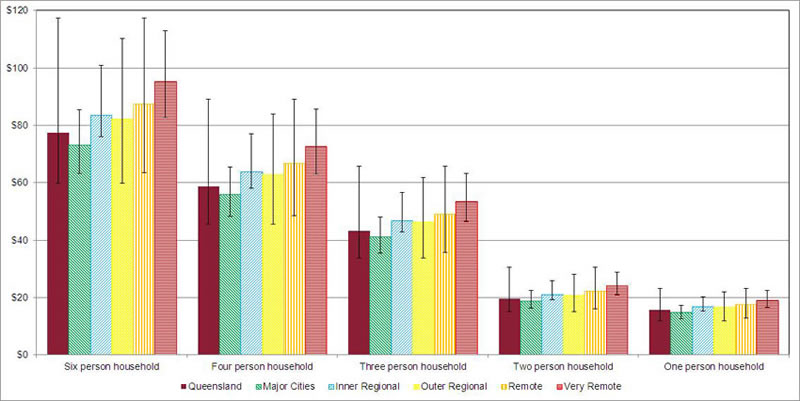
Source: Healthy Food Access Basket Survey 2014, Queensland Government Statistician's Office, Queensland Treasury and Trade.
© The State of Queensland (Queensland Treasury and Trade) (2014). Creative Commons: BY. This figure is suitable for Open Data.
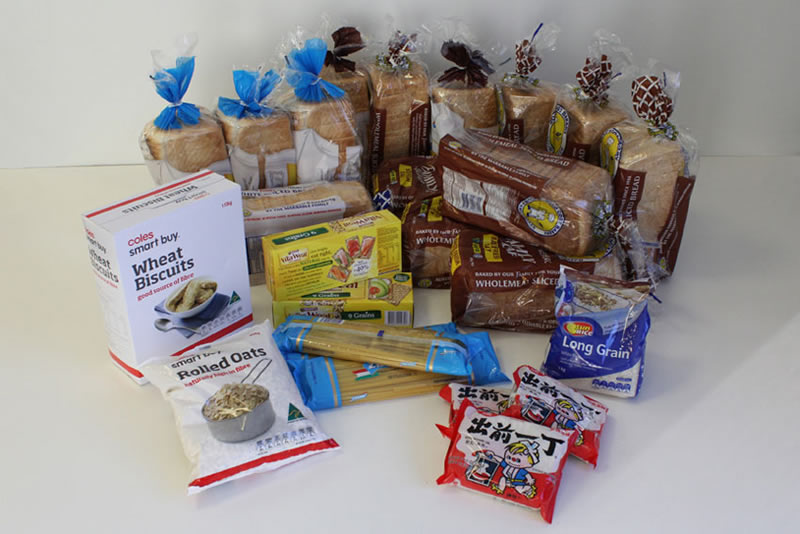
Figure 11: Quantity of grain foods for 6 person household
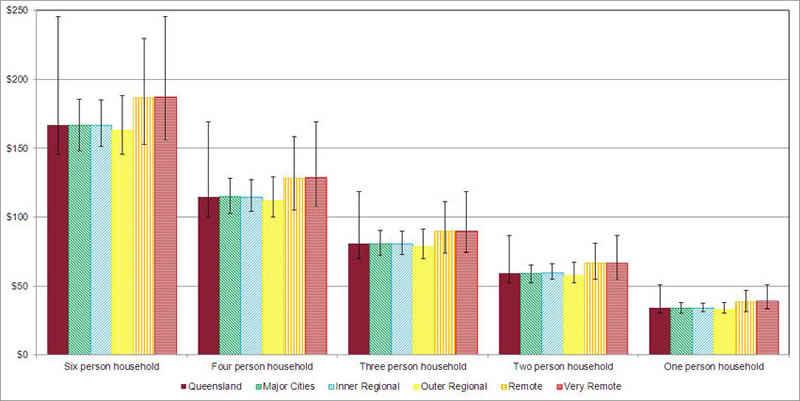
Lean meats, poultry, fish, eggs, nuts, and seeds
One person household
- Average cost: $39.25.
- $9.73 (24.8%) more in very remote areas than in major cities.
Two person household
- Average cost: $61.84.
- $15.44 (25.0%) more in very remote areas than in major cities.
Three person household
- Average cost: $95.60.
- $22.65 (23.9%) more in very remote areas than in major cities.
Four person household
- Average cost: $134.77.
- $32.38 (24.2%) more in very remote areas than in major cities.
Six person household
- Average cost: $185.99.
-
$44.55 (24.2%) more in very remote areas than in major cities.
Figure 12: Cost of lean meats, poultry, fish, eggs, nuts, and seeds - average and range
The small black bars represent the range of the minimum and maximum basket cost for each remoteness classification.
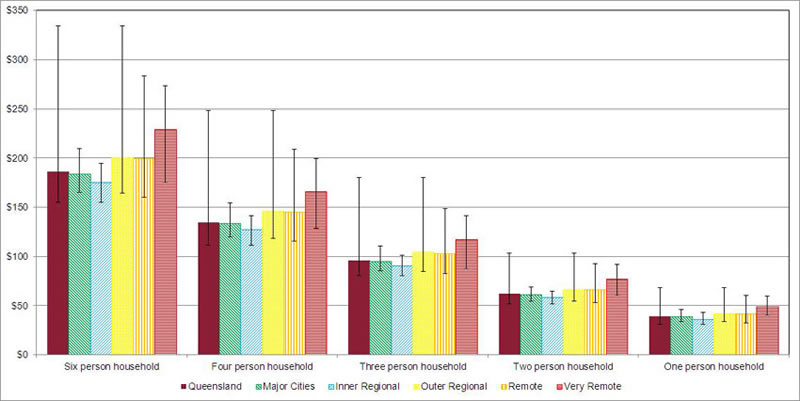
Source: Healthy Food Access Basket Survey 2014, Queensland Government Statistician's Office, Queensland Treasury and Trade.
© The State of Queensland (Queensland Treasury and Trade) (2014). Creative Commons: BY. This figure is suitable for Open Data.
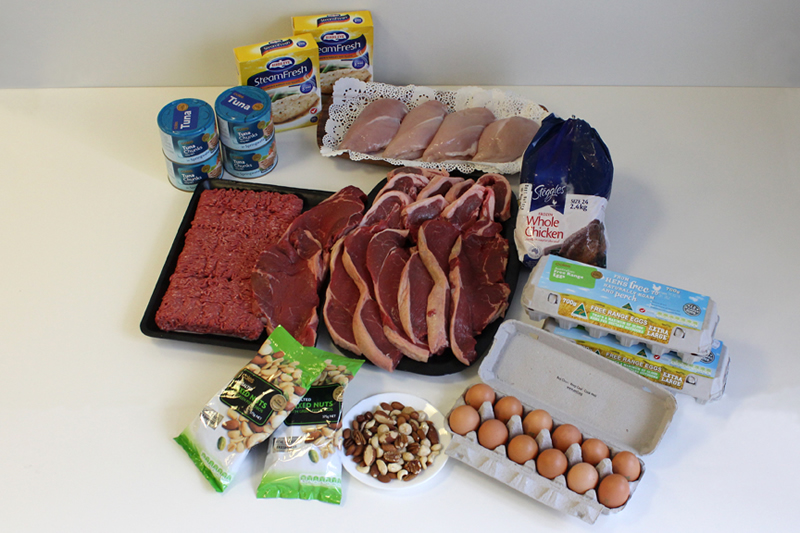
Figure 13: Quantity of lean meats, poultry, fish, eggs, nuts, and seeds for 6 person household
Milk, yoghurt, and cheese
One person household
- Average cost: $18.04.
- $6.61 (37.4%) more in very remote areas than in major cities.
Two person household
- Average cost: $56.43.
- $20.86 (37.6%) more in very remote areas than in major cities.
Three person household
- Average cost: $58.99.
- $21.88 (37.7%) more in very remote areas than in major cities.
Four person household
- Average cost: $76.95.
- $28.48 (37.6%) more in very remote areas than in major cities.
Six person household
- Average cost: $122.02.
-
$44.69 (37.4%) more in very remote areas than in major cities.
Figure 14: Cost of milk, yoghurt, and cheese - average and range
The small black bars represent the range of the minimum and maximum basket cost for each remoteness classification.
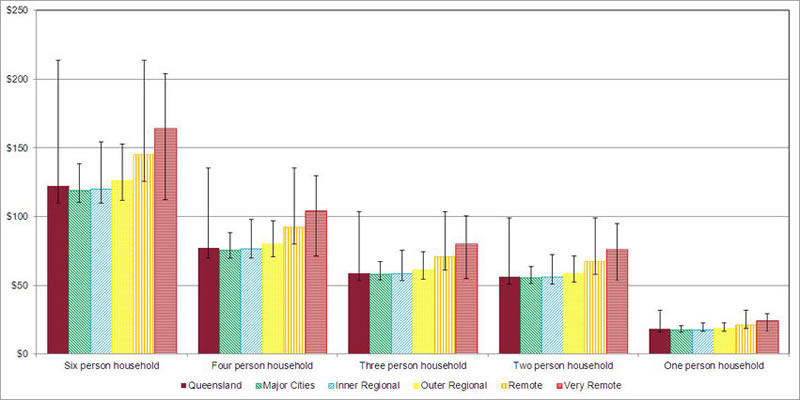
Source: Healthy Food Access Basket Survey 2014, Queensland Government Statistician's Office, Queensland Treasury and Trade.
© The State of Queensland (Queensland Treasury and Trade) (2014). Creative Commons: BY. This figure is suitable for Open Data.
Figure 15: Quantity of milk, yoghurt, and cheese for 6 person household
Unhealthy foods and tobacco
- Average cost: $73.15 (range: $63-109).
- Lowest cost: $71.39 (range: $63-76) in inner regional areas.
- Highest cost: $86.81(range: $67-109) in very remote areas.
Unhealthy food items
- 600mL bottle of soft drink
- Packet of cream-filled biscuits
- Small chocolate bar
- 50 gram packet of potato crisps
- Single-serve hot meat pie
Tobacco items
- Pouch of roll-your-own tobacco
-
25 pack of cigarettes
Figure 16: Cost of unhealthy foods and tobacco in 2014 - average and range
The small black bars represent the range of the minimum and maximum basket cost for each remoteness classification.
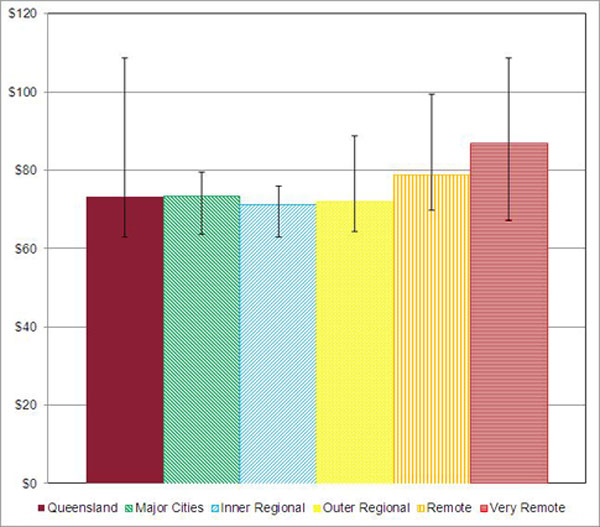
Source: Healthy Food Access Basket Survey 2014, Queensland Government Statistician's Office, Queensland Treasury and Trade.
© The State of Queensland (Queensland Treasury and Trade) (2014). Creative Commons: BY. This figure is suitable for Open Data.